I teach 5th and 6th grade math to beginning English learners. This post shares 3 critical math strategies that support ELLs in the understanding of math concepts AND in the language of math. These are three “must have” strategies for any math classroom with ESL students, especially those with newcomers!
Have you heard the saying, “math is a universal language?” I must admit, this drives me a little crazy. Have you seen “standardized” testing? There’s a LOT of language involved in math, and for students who are new to the country, this poses an obstacle. Not only do we need teach grade level math concepts to our students, but we also need to teach the language of math.
Math Strategies for English Learners
How can we best support our beginning ELLs in math? There is a reason I put vocabulary instruction at the top of the math strategies list. It simply cannot be ignored if we want our students to be successful.
1 – Vocabulary Instruction
There are three types of vocabulary: tier 1 is basic vocabulary, tier 2 is grade level vocabulary (terms most native English speakers are familiar with), and tier 3 is low frequency content specific vocabulary. ALL students need explicit instruction in the third tier! Being aware of all 3 types is important, and knowing your students is key in deciding which words might need front-loading before a lesson.
- Ex. of Tier 1 Basic Vocabulary – tall, short, fast, long, more, less, far, close, heavy, light, around, cover, most, many, about, big, small, fill, full, empty, all, etc.
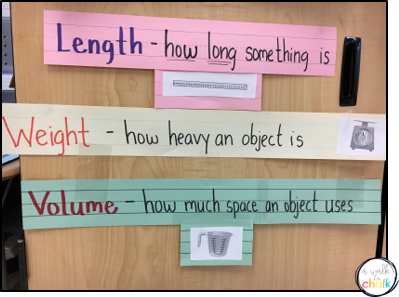
- Ex. of Tier 2 “Grade Level” Vocabulary (math language) – increase, decrease, greatest, least, altogether, replace, combine, random, weight, length, opposite, distance, etc.
- Ex. of Tier 3 Content Vocabulary – ratio, probability, quadrilaterals, polygons, equations, diameter, circumference, coefficient, variable, volume, capacity, scalene, kilometer, etc.
In classrooms with beginning ELLs, vocabulary is one of the main focuses of instruction. Terms from all 3 tiers need to be explicitly taught. Analyzing the math lesson during the planning phase and looking for terms that need front-loading is vital to providing comprehensible instruction. On days that I’m introducing a new concept, I KNOW that my primary focus is on vocabulary.
—- Vocabulary Building Activities —-
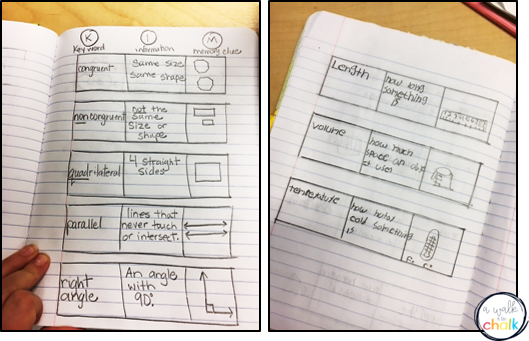
I use the KIM Strategy for direct vocabulary instruction. To read a post about this highly effective vocabulary strategy, click HERE.
Key vocabulary is introduced, a simple kid friendly definition is produced and visual “memory clue” is illustrated.
Make vocabulary fun:)
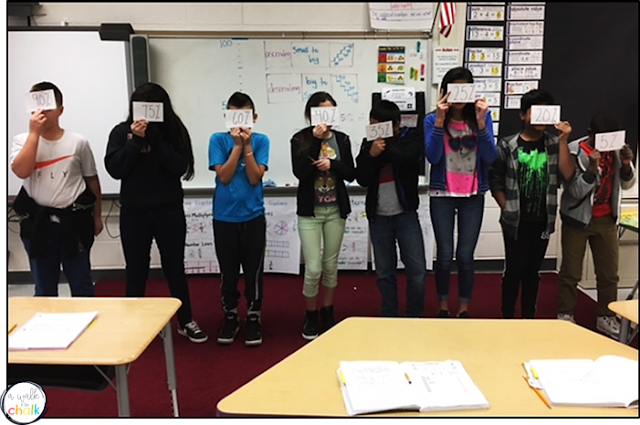
Write terms on one set of cards and visuals or examples on another set, then pass out cards to students. As an “exit ticket” they must find their matching partner.
The vocabulary terms on this day were “ascending” and “descending.” My sixth graders used the KIM strategy in their notebooks at the beginning of class. We practiced putting numbers (fractions, decimals, percent) in ascending and descending order. At the end of class, I passed out index cards with percentages, and their “exit” task was to get into descending order. Then I mixed the cards up and asked them to get into ascending order.
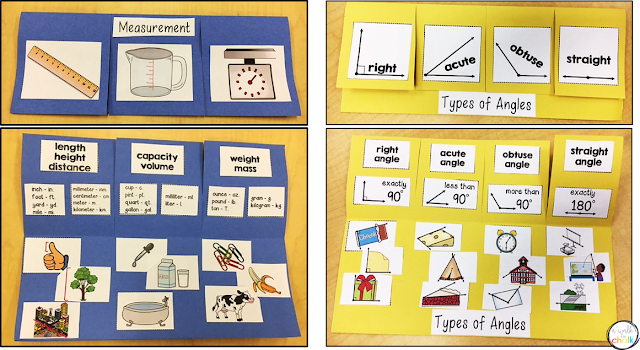
I always add an interactive notebook activity, or a foldable activity, to follow up. This resource provides students with a reference during their independent work time. These also are used as study tools before unit assessments.
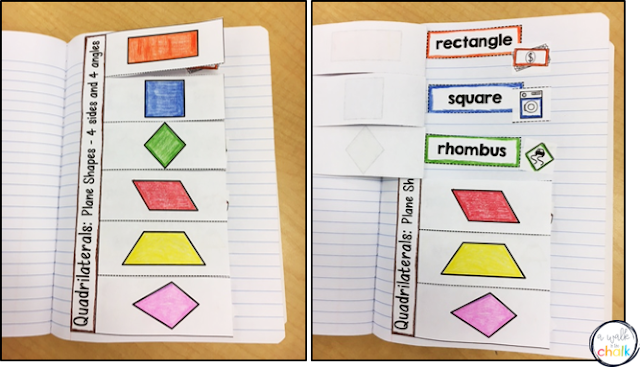 |
| Quadrilaterals Interactive Notebook Activity |
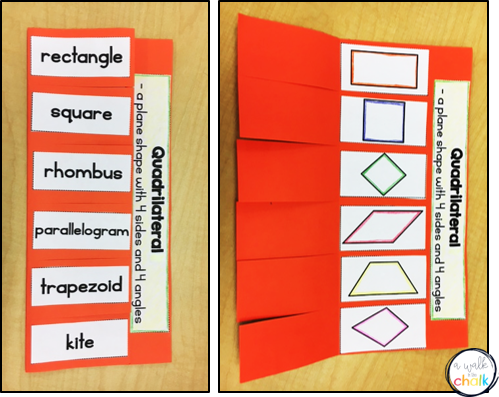 |
| Quadrilaterals Foldable Activity |
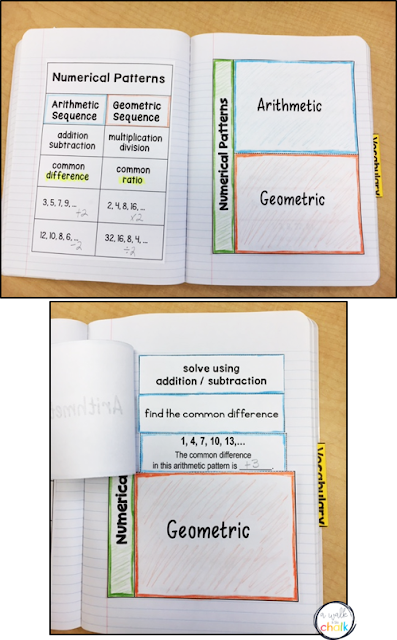 |
| Numerical Patterns Interactive Notebook Activity |
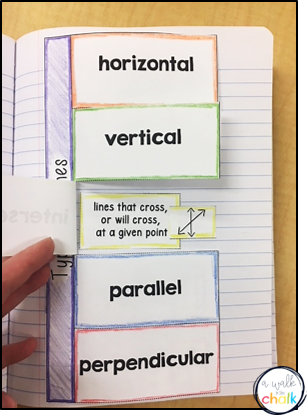 |
| Types of Lines Interactive Notebook Activity |
To find these math resources, click HERE.
The direct vocabulary instruction always come first, then I find ways to get my students up and out of their seats for fun vocabulary building activities. This physical activity helps to solidify their understanding. An interactive notebook, or foldable, activity usually follows. Then we practice using the vocabulary throughout the unit with sentence frames to support their language acquisition.
2 – Visuals and Anchor Charts
Beginning ELLs do the majority of their learning by watching. Meaningful visuals are key to their understanding. My lessons are loaded with visuals and I am constantly drawing pictures to show what something means. I really wish I could draw!!
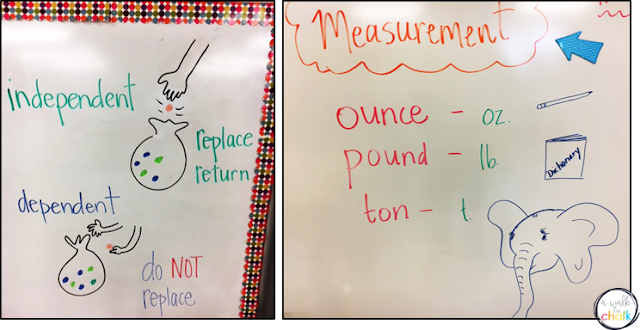 |
| That hand has 6 fingers!!! Yikes! |
It’s always a challenge, but my students get a kick out of my efforts. LOL! If only it could be this simple…
It would be so much easier for me, and for them! 🙂
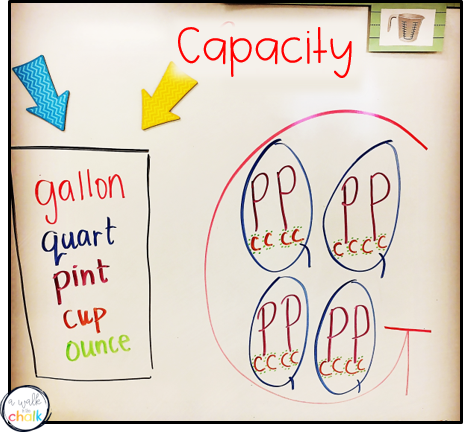
Color coding is also an effective visual strategy. My students copied this capacity “diagram” in their math notebooks using 5 different colors.
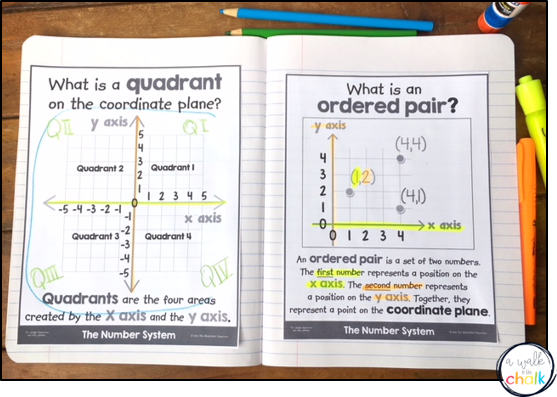
Add visuals to math notebooks for each lesson so that students have a reference.
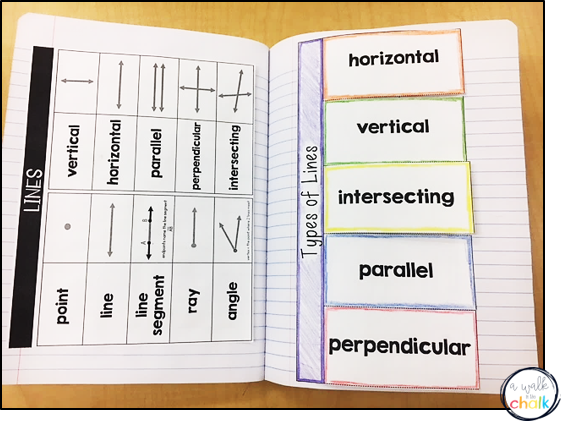 |
On the left hand page is a visual chart for the “Types of Lines” vocabulary. To be successful with independent activities, such as centers and homework, they have everything they need in their notebooks.
Use images that relate math to the real world around them.
I often use the “Essential Questions for 6th Grade Math” pages by The Illustrated Classroom. They’ve been a real life saver to me! The visuals are great and the text is simplified. I print them at 75%, cut the excess edges off, then have my students glue them into their notebooks. It works great!
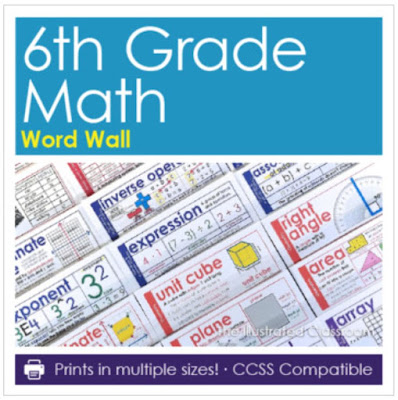
Create a visual math word wall. I use this word wall, also by The Illustrated Classroom. Another math reference tool with visuals, and a great place to introduce AND review content vocabulary.
Math Videos – I absolutely love using short math videos in class, especially the ones on You Tube by NumbeRock!!
 |
| NumbeRock videos are free on You Tube. He also has a ton of awesome math resources on TPT. |
The visuals are spot on, and each video is short, only about 2-3 minutes. My students love them and can see the math concepts in action. These videos are often a part of my introductory lessons.
I also use Brain Pop Jr. videos.
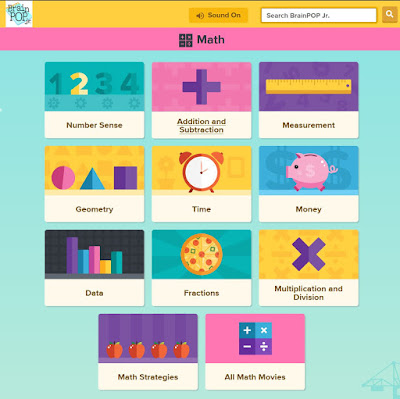 |
| Brain Pop Jr. is a paid subscription. |
Even though the “Jr.” version is for grades K-3, the focus is on vocabulary, and the language is simplified, so compared to the upper elementary BP version, I find that it’s a better fit for my beginning 5th and 6th graders.
Creating anchor charts is also invaluable. Pinterest is such a great place to find inspiration for math anchor charts! It’s my go-to destination for ideas! As long as we are learning about a concept, the anchor chart stays up for viewing. When we go back to review at the end of the year for state assessments, or spiral back to a concept later, the anchor chart gets pulled out again. Some charts stay up all year!
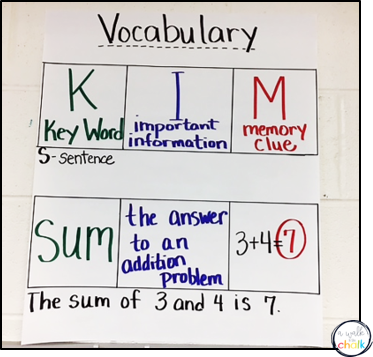 |
| KIM Vocabulary Strategy Poster. Students regularly use this format in the back of their math notebooks. |
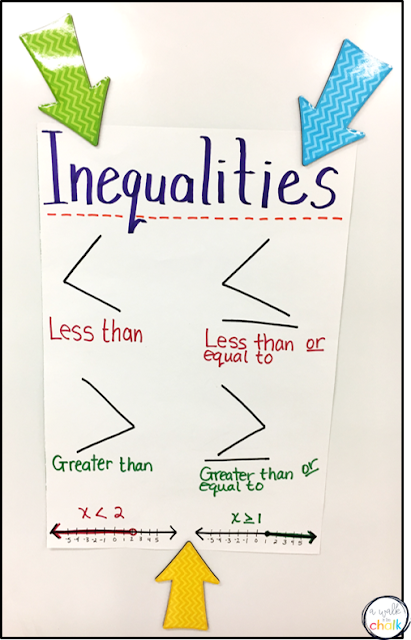 |
| Inequalities anchor chart |
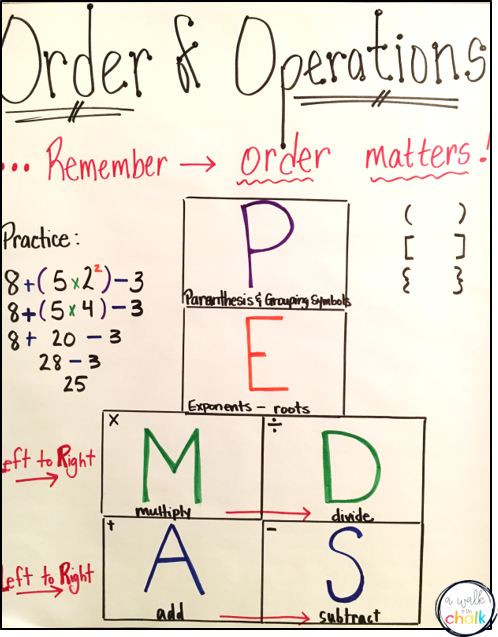 |
| Order of Operations anchor chart |
The most important thing to remember about teaching beginning English language learners, IMO, is that you need to show the concept visually FIRST, along with explicit vocabulary instruction. Even with definitions, adding a visual can be “worth a thousand words.” 😉
When I am planning a math lesson, I think to myself, “How can I show this concept to my students?” And… “Where can I add meaningful visuals?” If I’m teaching fractions, I want to show them parts of a whole. Maybe that means breaking a Hershey’s candy bar into pieces, or cutting a pan of brownies into equal parts. (I see a chocolate theme happening here!) If I am teaching probability, I want to show the concepts of certain, impossible, likely and unlikely.
It’s all about Visuals – Visuals – Visuals!!
3 – Hands On Activities
Manipulative and hands-on activities are a great way for students to see “how” math works. Cubes, tiles, measuring tools, foldable activities, food, tangrams, fraction pieces, dice and games are just some ways we can get our students working on and practicing math skills. When students are using their hands, they are focused on “doing” something, compared to when they are note taking or using receptive skills to understand a lesson or new vocabulary. Here they get to practice and try out their math thinking. It’s also a great way for ME to see what they understand, as well as what might need clarifying.
When math is FUN, and students have had both vocabulary building and meaningful visuals beforehand, the hands-on activities are where they can dive in and practice what they’ve learned.
—- Hands-On Activities —-
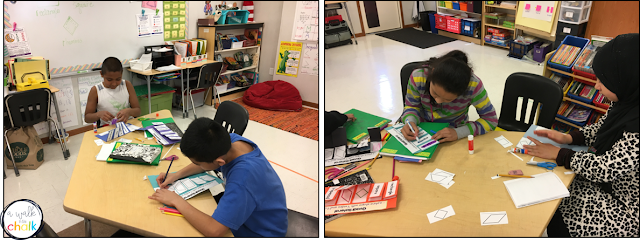 |
| Creating Math Foldables |
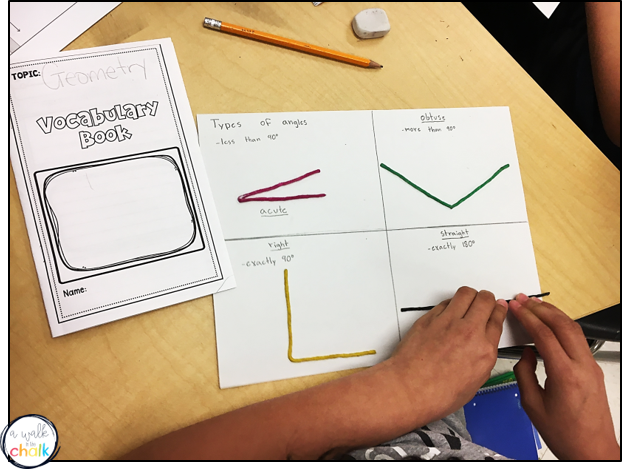 |
| Forming Angles with Wixi Sticks |
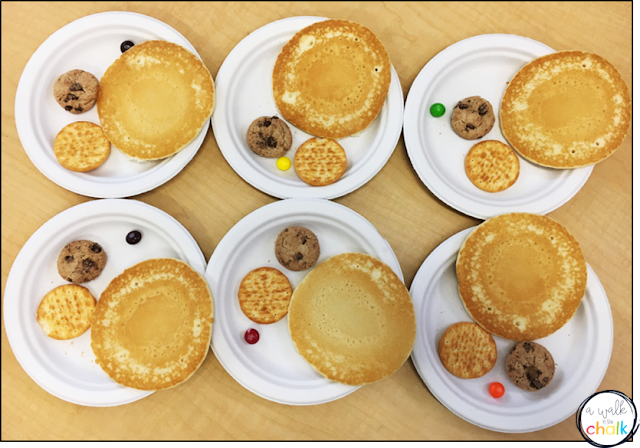 |
| Measuring circumference with round foods. Measuring that skittle was a challenge! |
 |
| FUN math games |
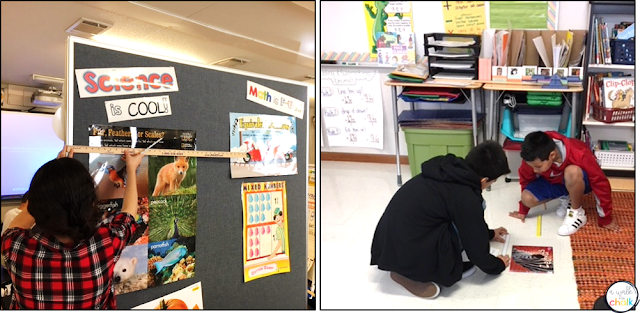 |
| Measuring Around the Room |
Vocabulary, visuals and hands-on activities are the 3 must-have strategies for any math classroom with English language learners, especially beginners. Here’s an example of all 3 in action.
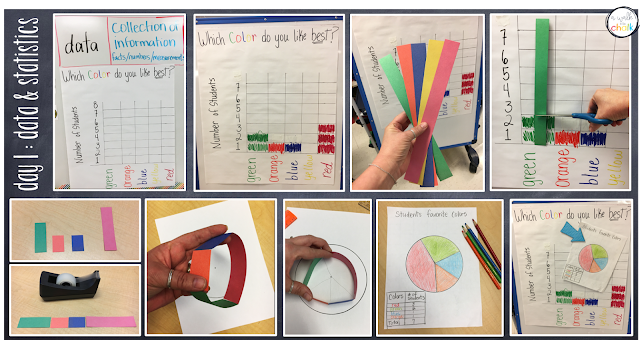
Visuals – Bar Graph Anchor Chart: Question Posed- “Which color do you like best?”
Collecting Data – Students come up and color in their favorite color choice. Then we analyze the the data. I ask questions like, Which color did most students like best? Which color did the least, or smallest, number of students like best? Which color did no students like the best? How many students chose the color red? How many students chose the color green? etc… This is a great time to build that tier 1 and 2 vocabulary.
Next, I want to model how to take this data and show it in a different way using a circle graph. See pics below.
>>> Data and Statistics – Day 2 <<<
We review the data from the circle graph and then convert fractions to percents in a whole group setting.
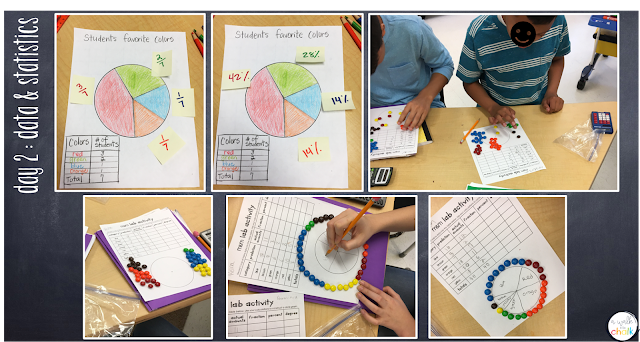 |
Hands-On Activity – My students gather data and use it to create their own circle graph. They will also convert fractions to percents.
They each get a baggie of skittles and predict how many are inside. Then they take out the skittles and gather their data. They count and note the amount for each color. Next they write the fraction for each color and convert that number into a decimal. Last, they create the circle graph the same way I modeled with the colored strips the day before. (The M&M Lab Activity by Lisa Tilmon can be found here.) My students all had a firm understanding of data collection after these 2 days. My teacher heart was smiling:)
I hope that you found some helpful tips in this post. I’d love to hear about a math strategy that you find to be a “must-have” when working with beginning English learners!

